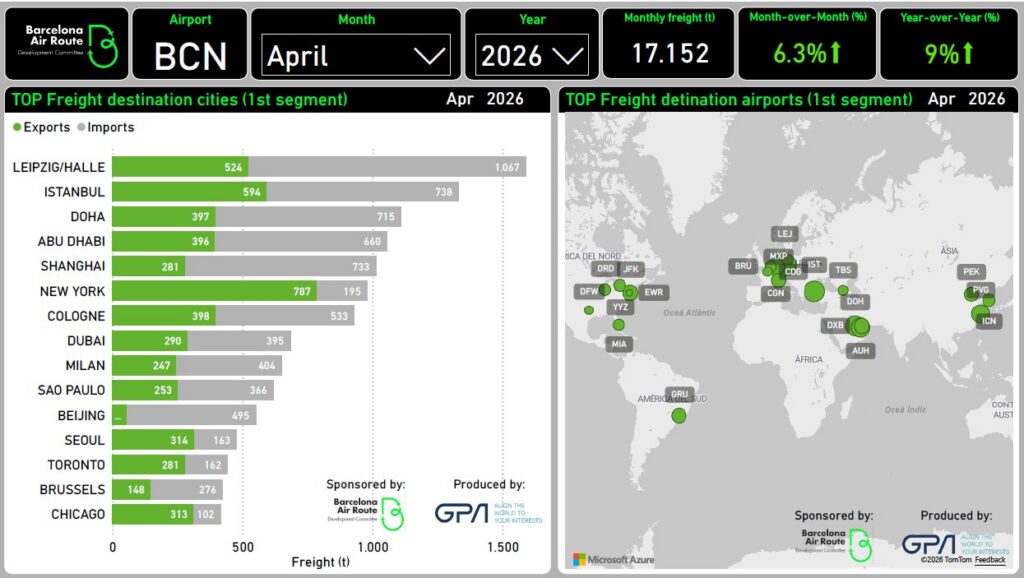
This report presents the main figures related to air cargo activity at Barcelona–El Prat Airport (BCN) for April 2026, based exclusively on the information displayed in the charts.
Monthly Air Freight Volume
In April 2026, total air freight handled at Barcelona Airport amounted to 17,152 tonnes, according to the Monthly freight (t) indicator shown in the dashboard.
This figure represents the total volume of cargo processed during the month through export and import operations, showing a +6.3% month‑over‑month increase and +9% year‑over‑year growth.
Top Air Freight Airlines
The Top Freight Airlines chart shows the distribution of air cargo volumes by airline for April 2026, distinguishing between exports and imports.
The airlines with the highest freight volumes during the month include:
- DHL
- Turkish Airlines
- American Airlines
- Qatar Airways
- UPS
Each airline shows different export and import volumes, as represented in the bar chart.
Evolution of Freight Activity by Airline
The Top Freight Airlines Evolution chart displays the monthly evolution of air cargo volumes, measured in tonnes, for the main airlines operating at BCN.
The period covered ranges from April 2025 to April 2026. The chart presents individual trends for airlines including:
- American Airlines
- ASL (Amazon)
- DHL
- Emirates
- Qatar Airways
- Turkish Airlines
- UPS
Cargo volumes are shown using line representations with values plotted on a monthly basis.
Top Air Freight Destination Cities (First segment)
The Top Freight Destination Cities chart identifies the main destination cities for air cargo transported from Barcelona Airport in April 2026, differentiating between export and import volumes.
The main destination cities include:
- Leipzig / Halle
- Istanbul
- Doha
- Abu Dhabi
- Shanghai
- New York
All volumes are expressed in tonnes and shown separately for exports and imports.
Destination Airports
The Top Freight Destination Airports map shows the geographical distribution of the main airports connected to BCN for air cargo operations in April 2026.
The map includes airports located across:
- Europe
- North America
- Asia
- The Middle East
- South America
Marker size reflects the relative freight volume associated with each airport.
Monthly Air Freight Evolution
The Freight Monthly Evolution chart presents the monthly air cargo volumes handled at Barcelona Airport over a twelve‑month period, from April 2025 to April 2026.
The chart shows the progression of monthly freight volumes expressed in tonnes, allowing for direct comparison between the different months and highlighting seasonal variations and consistent growth trends.
Full Monthly report 2026
Source: www.aena.es
Produced by GPA: www.gpa.aero